Carbon Storage Balance
Carbon Storage Balance – Comparison of model results
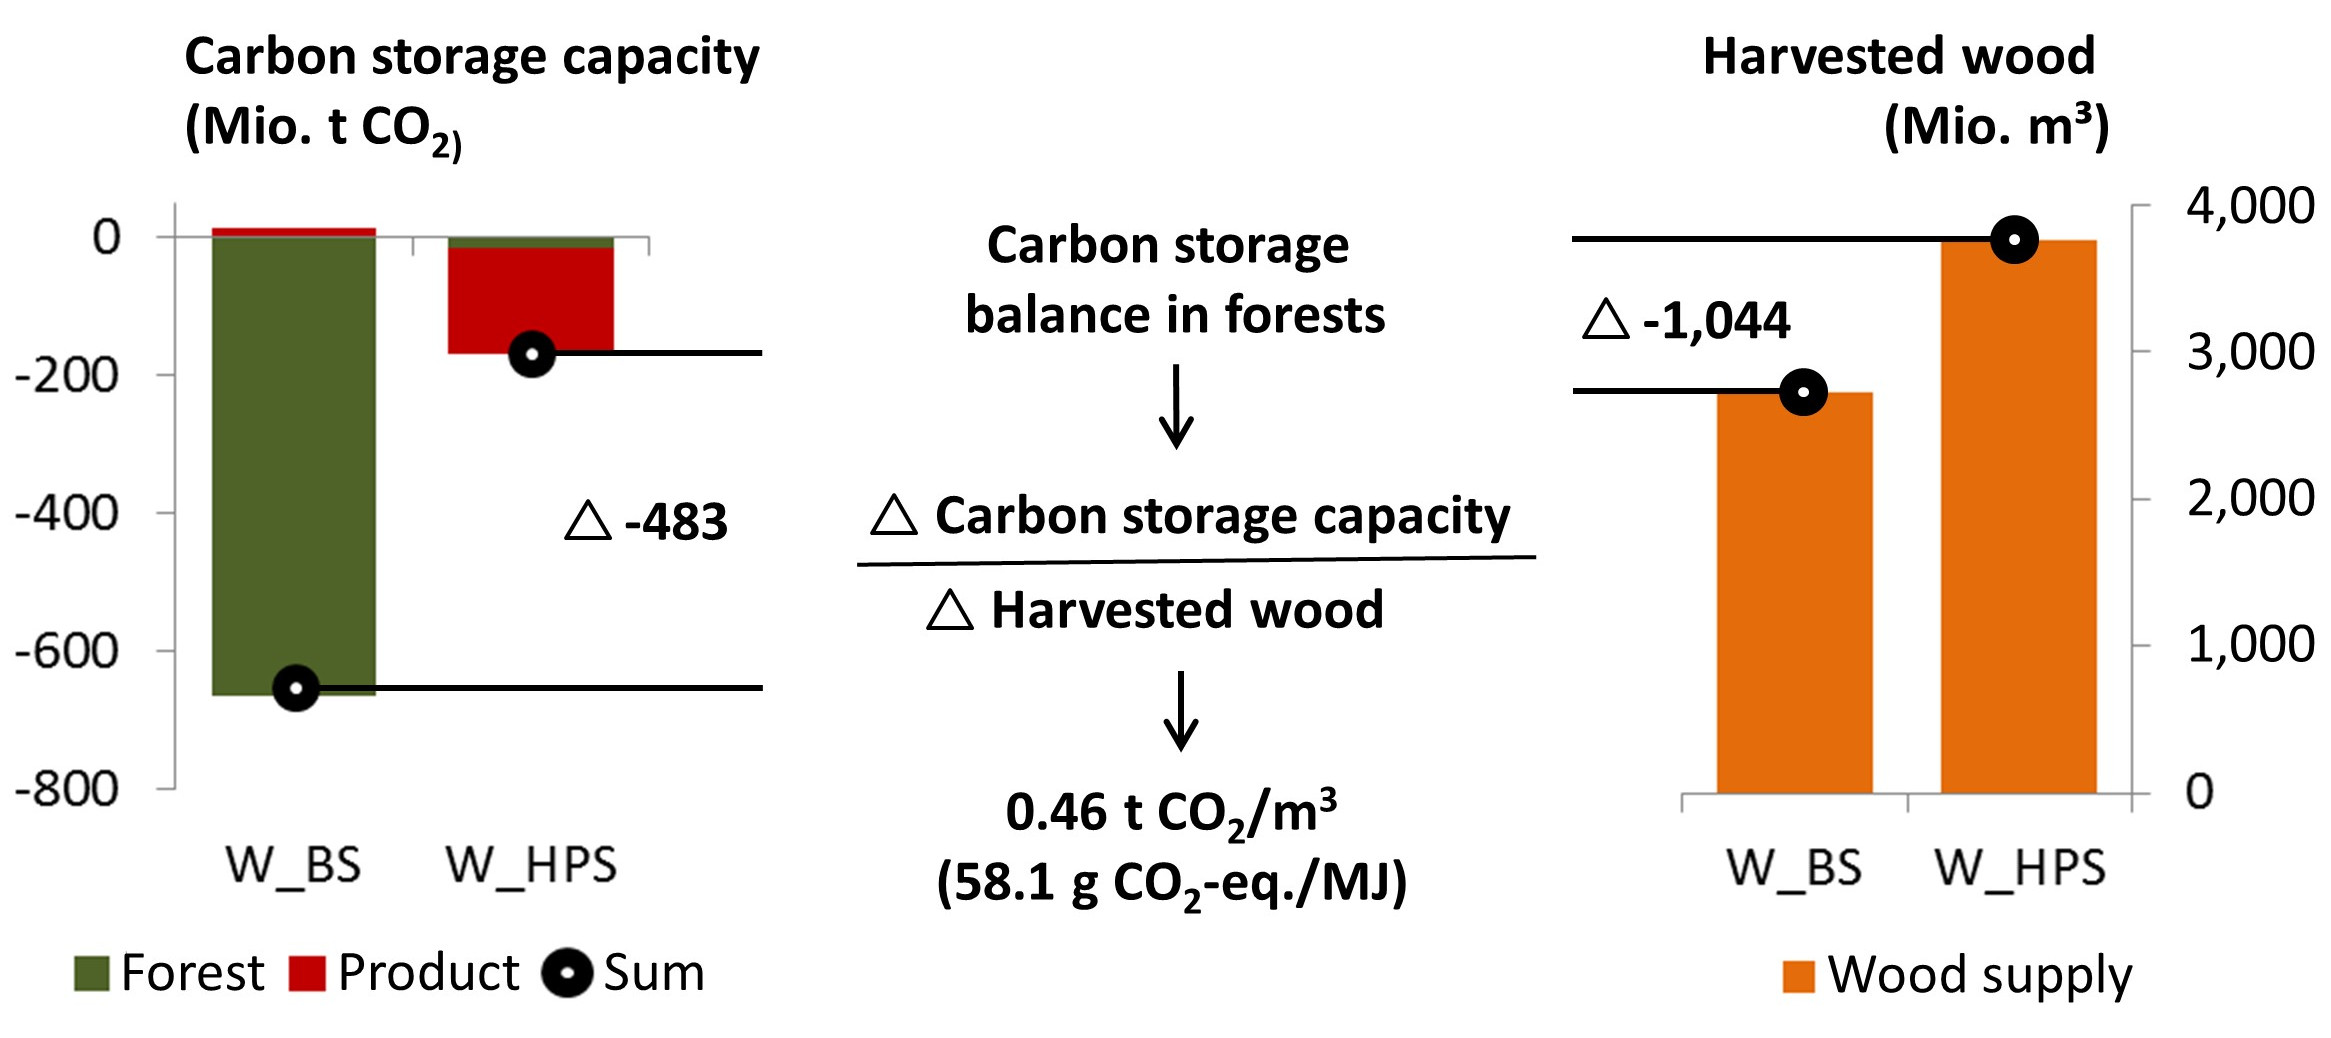
In the article "Carbon storage in forests and wood products", published in AFZ-DerWald (Hennenberg et al. 2019 [1]), a simple approach is shown by which effects of forest management on carbon storage can be integrated into greenhouse gas balances. For this purpose, based on the comparison of alternative forest management scenarios, the difference in the capacity for carbon storage (forest area, wood products) is related to the difference in wood supply (see Figure 1).
In Hennenberg et al. (2019 [1]), scenarios calculated with three forest models are compared as examples. The carbon storage balance depends on the initial situation of the stands (e.g. tree species composition and age structure) as well as assumptions on wood use and the time period considered. It can be calculated for forest biomass and wood products or for forest biomass only. In order to determine a range of carbon storage balance values, the carbon storage balance should be calculated for different initial situations and assumptions. In addition, to obtain some directional certainty, it is useful to perform comparable calculations with different models. The goal of this web page is to collect carbon storage balance values from different studies. We invite scientists to calculate carbon storage balances based on their results from comparing alternative management scenarios for different geographical units (e.g. Germany, federal state, region, stand level) and different wood use assumptions and to add to this data collection (contact: ).
For comparison:
| Scenario 1 (higher timber extraction) | Scenario 2 (lower timber extraction) | Framework data | Carbon storage balance (forest biomass and wood products) | Carbon storage balance (forest biomass only) | ||||||||||
|---|---|---|---|---|---|---|---|---|---|---|---|---|---|---|
| Scenario Name, Reference | Carbon storage capacity forest biomass | Carbon storage capacity of wood products | Wood supply | Scenario Name, Reference | Carbon storage capacity forest biomass | Carbon storage capacity wood products | Wood supply | Region | Model | Period | t CO2/m³ | g CO2-eq./MJ1 | t CO2/m³ | g CO2-eq./MJ1 |
| WEHAM Wood Preference Scenario [3] | -17.0 Mt CO2 | -152.0 Mt CO2 | 3,762 million m³ | WEHAM Base Scenario [2] | -664.5 Mt CO2 | 13.0 Mt CO2 | 2,717 million m³ | Germany | WEHAM | 2020-2050 | 0.46 | 58.1 | 0.62 | 78.3 |
| FABio Wood Scenario [5] | -32.7 Mt CO2 | 5.2 Mt CO2 | 2,751 million m³ | FABio Base Scenario [5] | -565.5 Mt CO2 | 40.1 Mt CO2 | 2,380 million m³ | Germany | FABio | 2020-2050 | 1.34 | 169.2 | 1.44 | 181.8 |
| FABio Base Scenario [5] | -565.5 Mt CO2 | 40.1 Mt CO2 | 2,380 million m³ | FABio Forest Vision [5] | -1,943.7 Mt CO2 | 206.2 Mt CO2 | 1,558 million m³ | Germany | FABio | 2020-2050 | 1.47 | 185.6 | 1.68 | 212.1 |
| FABio Forest Vision [5] | -1,943.7 Mt CO2 | 206.2 Mt CO2 | 1,558 million m³ | FABio No-use Scenario (Öko-Institut. unpublished data) | -4,005.0 Mt CO2 | 550.0 Mt CO2 | 0 million m³ | Germany | FABio | 2020-2050 | 1.10 | 138.9 | 1.32 | 166.7 |
| FABio Wood Scenario [5] | -32.7 Mt CO2 | 5.2 Mt CO2 | 2,751 million m³ | FABio No-use Scenario (Öko-Institut. unpublished data) | -4,005.0 Mt CO2 | 550.0 Mt CO2 | 0 million m³ | Germany | FABio | 2020-2050 | 1.25 | 157.8 | 1.44 | 181.8 |
| SILVA_Hainich Use Scenario [6] | 23.9 t CO2/ha | -30.4 t CO2/ha | 196.8 m³/ha | SILVA_Hainich No-use Scenario [6] | -137.7 t CO2/ha | 0 t CO2/ha | 0 m³/ha | Model region in Thuringia | SILVA | 30 years | 0.67 | 84.6 | 0.82 | 103.5 |
| SILVA Hohe-Schrecke Use Scenario [6] | -5.2 t CO2/ha | -16.2 t CO2/ha | 175.8 m³/ha | SILVA Hohe-Schrecke No-use Scenario [6] | -132.2 t CO2/ha | 0 t CO2/ha | 0 m³/ha | Model region in Thuringia | SILVA | 30 years | 0.63 | 79.5 | 0.72 | 90.9 |
| SILVA Vessertal Use Scenario [6] | -52.0 t CO2/ha | -21.6 t CO2/ha | 213.0 m³/ha | SILVA Vessertal No-use Scenario [6] | -313.0 t CO2/ha | 0 t CO2/ha | 0 m³/ha | Model region in Thuringia | SILVA | 30 years | 1.12 | 141.4 | 1.23 | 155.3 |
Im Holzpräferenzszenario wird gegenüber dem Basisszenario das Holzaufkommen gesteigert, in dem das Produktionsende und die Zielstärken der Baumarten optimiert werden. Zudem wird die Nadelbaumart Douglasie stark gefördert
Das Basisszenario projiziert die Waldentwicklung unter der Fortsetzung der derzeitig beabsichtigten und absehbaren Waldbehandlung
Unterschieden werden in der Studie das Basisszenario, in dem die zurzeit vorherrschende Nutzungsintensität fortgeschrieben wird, das Holzszenario mit erhöhten Durchforstungs- und Entnahmemengen und einer Förderung von Nadelbäumen, sowie das Szenario Waldvision, in dem Zieldurchmesser erhöht und Eingriffsfrequenzen deutlich gesenkt, Laubbäume gegenüber Nadelbäumen gefördert und die ungenutzte Fläche von 4,1% auf 16,6% erhöht wird.
Siehe auch: https://waldvision.de/
In der Studie sind die Ergebnisse des SILVA-Modells aus drei Modellregionen in Thüringen dargestellt. Diese Modellregionen repräsentieren reiche Buchenwälder (Hainich), bodensaure Buchenwälder (Hohe Schrecke) bzw. Fichten- und Bergmischwälder (Vessertal). Verglichen werden dabei je ein Szenario, das die in Thüringen übliche forstliche Nutzung abbildet ("Nutzung"), und ein Nullnutzungsszenario ("Schutz").